The Pulse of Marine Life
A fundamental metric for ocean health is the biomass and biodiversity of key species populations. Monitoring top predators, forage fish, and foundational organisms provides a direct measure of ecological energy flow and trophic stability. Significant deviations from historical baselines signal systemic disruption.
Genetic diversity within populations acts as a critical buffer against environmental change. Higher genetic variability enhances species resilience to diseases and shifting climatic conditions. This intrinsic diversity is often the first casualty of population decline and habitat fragmentation.
Scientists now prioritize tracking the abundance of indicator species that reflect broader ecosystem conditions. These species' population trends offer an integrated narrative of cumulative impacts, from pollution to fisheries pressure, that simpler chemical measures might miss.
Advanced techniques like environmental DNA (eDNA) metabarcoding have revolutionized population assessments. This method allows for non-invasive, large-scale monitoring of species presence and relative abundance by detecting genetic material shed into the water. It provides a powerful tool for establishing contemporary biodiversity baselines in an era of rapid change.
Mapping the Living Foundation
The spatial extent and physiological condition of primary producers form the essential bedrock of marine ecosystem health. Seagrass meadows, mangrove forests, kelp forests, and coral reefs are not merely habitats but biogenic engineers that structure the physical and chemical environment.
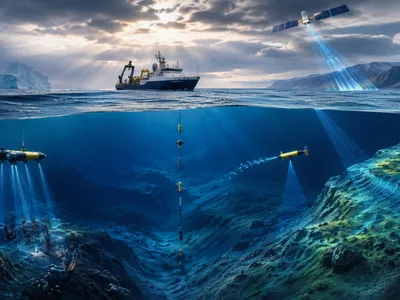
Satellite remote sensing and autonomous underwater vehicles enable precise mapping of habitat cover and loss over time. Metrics such as percent cover, canopy height, and calcification rates translate visual data into quantifiable indicators of foundation species vitality and carbon sequestration potential.
The concept of 'habitat functional integrity' has gained prominence, moving beyond simple area measurements. This approach assesses whether a habitat is performing its ecological roles, such as nursery provision, nutrient cycling, and shoreline protection, at expected levels based on its type and size.
Chronic stressors like elevated sea surface temperatures and acute disturbances from storms lead to measurable declines in habitat quality. Tracking recovery rates after such events is a crucial sub-metric, indicating the resilience and regenerative capacity of these foundational ecosystems.
The table below summarizes key attributes and monitoring approaches for major marine foundational habitats.
| Foundation Habitat | Primary Health Metric | Key Threat | Primary Monitoring Tool |
|---|---|---|---|
| Coral Reefs | Live Coral Cover % & Colony Size | Thermal Stress (Bleaching) | Photogrammetry, Spectral Analysis |
| Mangrove Forests | Canopy Density & Sediment Accretion | Coastal Development & Aquaculture | LiDAR, Satellite Imagery |
| Seagrass Meadows | Shoot Density & Areal Extent | Eutrophication, Turbidity | Sonar, AUV Imagery |
| Kelp Forests | Stipe Density & Biomass | Ocean Warming, Urchin Barrens | Satellite (Sentinel-2), UAV Surveys |
Oxygenation and the Ocean's Breath
Dissolved oxygen concentration is a master variable governing the distribution, physiology, and survival of marine life. Hypoxic and anoxic zones represent areas of severe habitat compression and biogeochemical disruption. The global expansion of these oxygen-minimum zones is a critical health indicator.
The primary drivers of deoxygenation are ocean stratification from warming surface waters and increased nutrient-driven microbial respiration. Warmer water holds less oxygen, while excess nutrients from land stimulate algal blooms whose subsequent decay consumes available oxygen.
Monitoring networks now track the depth, volume, and duration of hypoxic events. These three-dimensional metrics provide a more complete picture of oxygen stress than single-point measurements. Persistent oxygen depletion alters nitrogen cycling and can produce potent greenhouse gases like nitrous oxide.
Advanced profiling floats equipped with oxygen sensors deliver high-frequency data across vast ocean basins, revealing seasonal dynamics and long-term trends. This data is synthesized into oxygen inventory assessments, quantifying the total oxygen content change in entire ocean layers and linking it to climate models and ecosystem forecasts with increasing accuracy.
The following table categorizes the severity levels of ocean deoxygenation based on dissolved oxygen concentrations and their direct ecological consequences, illustrating the threshold effects that can lead to rapid ecosystem restructuring and biodiversity loss.
| Oxygen Status | Dissolved Oxygen (mg/L) | Direct Biological Impact |
|---|---|---|
| Normoxic | > 5.0 | Supports full biodiversity and growth. |
| Hypoxic | 2.0 - 5.0 | Stress for mobile organisms; avoidance behavior initiated. |
| Severely Hypoxic | < 2.0 | Death of most fish and crustaceans; only microbes and some invertebrates persist. |
| Anoxic | 0 | Dominance of anaerobic microbes; production of hydrogen sulfide. |
Key biological responses to declining oxygen form a cascade of impacts. Physiological stress begins long before lethal thresholds are reached, reducing growth, reproduction, and overall fitness. These sub-lethal effects can destabilize food webs long before mass mortality events occur.
- Habitat Compression: Mobile species are forced into narrower, oxygen-rich surface layers, increasing predation risk and competition.
- Trophic Mismatch: Prey and predator distributions diverge as species exhibit different oxygen tolerances and avoidance behaviors.
- Increased Vulnerability: Oxygen-stressed organisms are more susceptible to pathogens, parasites, and additional stressors like ocean acidification.
- Microbial Shift: Low-oxygen conditions favor different microbial communities that alter fundamental nutrient cycles, such as promoting denitrification.
How Do Human Activities Disturb the System?
Anthropogenic pressures create cumulative and synergistic stresses that degrade ocean resilience. The multiple stressor paradigm is central to modern assessment, recognizing that impacts from warming, acidification, and pollution are not additive but often multiplicative.
Land-based pollution delivers excess nutrients and novel entities like pharmaceuticals and microplastics into coastal systems. These pollutants can cause endocrine disruption in marine life and alter sediment composition. Their effects are pervasive and often chronic rather than acute.
Underwater noise pollution from shipping, seismic surveys, and construction is a pervasive but less visible stressor. It disrupts communication, navigation, and foraging behaviors for acoustically sensitive species, including cetaceans and many fish. Chronic noise elevates stress hormones and can lead to habitat abandonment.
The extraction of living resources through fishing alters population structures and food web dynamics in profound ways. Selective removal of top predators and high-value species can trigger trophic cascades, while non-selective gear damages seafloor habitats and results in significant bycatch. These fishing pressures change the evolutionary trajectory of populations, favoring earlier maturity and smaller size.
Coastal development and modification destroy or fragment critical habitats like mangroves and salt marshes, which are vital for carbon sequestrtion and as nursery grounds. The resulting loss of ecosystem services is compounded by increased vulnerability to storm surges and erosion, creating a feedback loop that further degrades nearshore environmental quality and biodiversity.
The primary anthropogenic drivers of ocean change interact in complex ways, creating management challenges that require integrated solutions rather than single-issue responses. The following list outlines the dominant human-induced pressures and their primary pathways of ecosystem impact.
- Climate Change Drivers Thermal, Chemical
- Pathway: Atmospheric CO₂ increase causes ocean warming, acidification, and deoxygenation, fundamentally altering physiological and biogeochemical processes.
- Direct Resource Exploitation Biological, Physical
- Pathway: Fishing, mining, and harvesting remove biomass and structure, directly reducing populations and degrading complex habitats.
- Land/River-Based Pollution Chemical, Nutrient
- Pathway: Runoff introduces nutrients, sediments, toxins, and plastics, leading to eutrophication, toxicity, and smothering of benthic life.
- Habitat Modification Physical
- Pathway: Coastal development, dredging, and infrastructure destroy or fragment ecosystems, reducing connectivity and resilience.
Quantifying the cumulative impact footprint of these combined activities across seascapes is a major focus of current research. Spatial mapping of stressor overlays reveals hotspots of vulnerability where multiple pressures exceed ecosystem coping capacities, guiding targeted management intervention.
Integrating Metrics for Holistic Assessments
Effective ocean management requires moving beyond siloed indicators to integrated ecosystem assessments. These assessments combine physical, chemical, and biological metrics to evaluate overall ecosystem structure, function, and resilience. The goal is to capture emergent properties that single metrics cannot reveal.
Multivariate statistical models and ecological network analyses are powerful tools for integration. They can identify key leverage points and tipping elements within complex marine systems. These models help quantify how pressure on one metric, like dissolved oxygen, cascades through others, such as species distribution and habitat quality.
The development of composite indices, such as the Ocean Health Index, represents a significant advancement. These indices aggregate diverse data streams into a single, communicable score. However, their construction requires careful weighting of component metrics to avoid masking critical local declines with broad-scale averages. A central challenge lies in balancing spatial and temporal scales. Metrics relevant for a coastal estuary may not apply to the open ocean, and short-term variability can obscure long-term trends. Successful integration therefore depends on a nested monitoring approach that links high-frequency local sensors with satellite-derived global data products.
The concept of ecosystem essential ocean variables has been established to standardize global monitoring efforts. These variables are the minimum set required to detect changes in ecosystem state and are deliberately chosen for their feasibility, relevance, and interconnectedness. They guide international observing programs and ensure data comparability.
The table below illustrates a framework for integrating the five core metrics into a tiered assessment of ecosystem health, moving from simple state description to complex functional understanding and predictive capability. This framework supports adaptive management by clarifying which interventions might be most effective for a given system state.
| Assessment Tier | Integrated Metrics Focus | Management Insight Provided |
|---|---|---|
| Tier 1: State | Current levels of biodiversity, habitat extent, oxygen, and human pressures measured against baselines. | Identifies which metrics are outside acceptable ranges and where. |
| Tier 2: Function | Interactions between metrics (e.g., how deoxygenation reduces suitable habitat for key species). | Reveals ecological consequences and potential cascading failures. |
| Tier 3: Forecast | Models projecting future states under different management and climate scenarios using integrated data. | Evaluates the potential outcomes and efficacy of alternative policy and restoration actions. |
Ultimately, the integration of metrics enables the calculation of ecosystem resilience and the identification of non-linear thresholds and iirreversible regime shifts. This proactive approach is vital for prioritizing conservation efforts where they can have the greatest stabilizing effect on the marine environment.
From Measurement to Management and Restoration
Robust metrics are the critical link between scientific observation and effective policy implementation. They provide the evidence base for setting quantifiable targets and legally binding thresholds in environmental legislation. Without clear metrics, management goals remain vague and progress unmeasurable.
Marine Protected Areas (MPAs) exemplify metric-driven management. Their design and success evaluation rely on metrics for habitat representation, population recovery, and spillover effects. High-frequency monitoring data within MPAs allows for adaptive management, where protection strategies can be modified in response to observed ecological changes.
In restoration ecology, pre- and post-intervention metric tracking is non-negotiable. Successful coral reef restoration, for instance, is measured not just by coral transplant survival but by the return of associated fish communities, calcium carbonate accretion rates, and the reduction of macroalgal cover. These multifaceted metrics determine the functional success of the intervention.
The emerging practice of ecosystem-based management applies integrated metrics across entire seascapes, coordinating human activities to maintain ecosystems in a healthy, productive, and resilient condition. This approach requires sustained monitoring to inform dynamic ocean zoning, sustainable fisheries quotas, and pollution reduction schemes, ensuring that human use does not compromise the underlying ecological processes that support it.