The Planetary Thermometer: Surface Temperature Records
Instrumental temperature records, meticulously compiled by institutions like NASA's Goddard Institute for Space Studies (GISS) and the Met Office Hadley Centre, constitute the most direct evidence of global warming. These datasets, derived from land stations, ships, and buoys, undergo complex homogenization to correct for urban heat island effects and station relocations. The fundamental metric, the global mean surface temperature (GMST) anomaly, reveals a unequivocal warming trend of approximately 1.1°C since the late 19th century.
Analyzing the spatial distribution of warming is equally critical. High-latitude regions, particularly in the Arctic, are experiencing temperature increases at a rate two to three times faster than the global average, a phenomenon known as Arctic amplification. This disproportionate warming is primarily driven by ice-albedo feedback mechanisms, where melting snow and ice reduce surface reflectivity, leading to increased absorption of solar radiation and further warming.
The temporal evolution of this warming is not linear but superimposed with natural variability, such as El Niño-Southern Oscillation (ENSO) events and volcanic eruptions. Advanced statistical methods, including linear regression analysis and machine learning-based detrending, are employed to isolate the anthropogenic signal from this noise. The consistency across independently maintained datasets (GISTEMP, HadCRUT5, Berkeley Earth) provides a robust consensus, reducing uncertainty and affirming that the observed warming is unprecedented in at least the last 2,000 years.
| Dataset | Base Period | 2023 Anomaly (°C) | Trend (°C/decade since 1970) |
|---|---|---|---|
| NASA GISTEMP v4 | 1951-1980 | +1.17 | +0.19 |
| HadCRUT5 | 1961-1990 | +1.15 | +0.18 |
| NOAA GlobalTemp v5 | 1901-2000 | +1.01 | +0.17 |
Oceanic Heat Reservoirs and Thermal Expansion
The world's oceans are the primary heat sink for the climate system, absorbing over 90% of the excess energy trapped by rising greenhouse gas concentrations. This is quantified through the measurement of Ocean Heat Content (OHC) down to 2000 meters depth, utilizing a global array of Argo profiling floats. These autonomous instruments provide near-real-time data on temperature and salinity, revealing a relentless and accelerating uptake of heat.
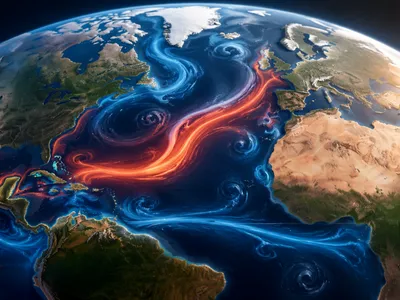
Thermal expansion, resulting from the physical property of seawater to expand as it warms, is a dominant contributor to global sea-level rise. The steric component of sea-level change can be precisely calculated by integrating temperature and salinity profiles over depth. This process is not uniform globally; regional patterns are modulated by ocean circulation dynamics, such as the Atlantic Meridional Overturning Circulation (AMOC), which redistributes heat vertically and meridionally.
The penetration of this anomalous heat is altering fundamental oceanic structures. The mixed layer depth is increasing in many regions, while stratification is intensifying, inhibiting vertical mixing and nutrient supply. Furthermore, the accumulation of heat in deeper oceanic layers, particularly in the Southern Ocean, commits the planet to continued sea-level rise and atmospheric warming for centuries due to the ocean's immense thermal inertia, even if atmospheric greenhouse gas concentrations were stabilized immediately.
| Ocean Basin (0-2000m) | Heat Gain (1993-2023) in Zettajoules | Contribution to Sea-Level Rise (Thermal Expansion, mm/yr) |
|---|---|---|
| Global Ocean | ~435 ZJ | ~1.4 ± 0.2 |
| Atlantic Ocean | ~155 ZJ | ~0.5 |
| Pacific Ocean | ~165 ZJ | ~0.5 |
| Indian Ocean | ~85 ZJ | ~0.3 |
| Southern Ocean | ~30 ZJ | ~0.1 |
The Cryosphere's Diminishing Returns
The cryosphere, encompassing Earth's frozen water domains, serves as a highly sensitive and visually compelling indicator of climate change. Satellite altimetry and gravimetry missions like ICESat-2 and GRACE/GRACE-FO provide precise, basin-scale mass balance measurements for the Greenland and Antarctic Ice Sheets. These data reveal a tripling of ice loss rates since the 1990s, contributng directly to eustatic sea-level rise through dynamical discharge and surface melt.
Arctic sea ice extent, monitored continuously since 1979, shows a pronounced and accelerating decline in both summer minimum and winter maximum coverage. The transition is towards a younger, thinner, and more seasonal ice pack, which is more vulnerable to melt. This reduction in albedo creates a powerful positive feedback loop, exacerbating regional warming and influencing mid-latitude weather patterns through altered jet stream dynamics.
- Glacial Retreat: Global glacier mass loss, documented by the World Glacier Monitoring Service, is pervasive and accelerating, threatening downstream water resources for millions.
- Permafrost Thaw: The warming and deepening of the active layer in permafrost regions is releasing stored carbon (methane and CO₂), creating a second critical feedback loop.
- Snow Cover Reduction: Northern Hemisphere spring snow cover exhibits a significant long-term decline, affecting surface hydrology, albedo, and seasonal water availability.
Deciphering Atmospheric Chemistry
Atmospheric composition data form the foundational causal link between human activity and observed climatic trends. The Keeling Curve, a continuous record of atmospheric CO₂ from Mauna Loa since 1958, is the seminal dataset, showing a steady rise from ~315 ppm to over 420 ppm today. This increase is directly attributable to fossil fuel combustion and land-use change, as confirmed by isotopic carbon (δ¹³C) analysis.
Monitoring of other potent greenhouse gases, such as methane (CH₄) and nitrous oxide (N₂O), reveals complex and concerning trends. Methane concentrations are increasing at an accelerating rate, likely driven by a combination of agricultural expansion, fossil fuel extraction, and feedbacks from tropical wetlands. Advanced spectroscopic data from networks like the Total Carbon Column Observing Network (TCCON) and satellites like GOSAT and OCO-2 provide global column-averaged dry-air mole fractions, enabling source attribution and sink quantification.
The concept of radiative forcing (RF) quantifies the net energy imbalance imposed by changes in atmospheric constituents. Positive RF values indicate a warming influence. The IPCC's Sixth Assessment Report calculates the total anthropogenic RF at 2.72 W/m² (2019 relative to 1750), with CO₂ contributing about 1.68 W/m². This precise quantification, derived from laboratory spectroscopy and atmospheric radiative transfer models, directly connects compositional changes to the planetary energy imbalance. Aerosols, which generally exert a cooling negative RF, add significant uncertainty to total forcing estimates and complicate climate sensitivity calculations.
| Greenhouse Gas | Pre-Industrial Level (1750) | Current Level (2023) | Radiative Forcing (W/m²) | Primary Anthropogenic Sources |
|---|---|---|---|---|
| Carbon Dioxide (CO₂) | ~278 ppm | ~419 ppm | +1.68 | Fossil fuels, deforestation |
| Methane (CH₄) | ~722 ppb | ~1922 ppb | +0.54 | Agriculture, waste, fossil fuels |
| Nitrous Oxide (N₂O) | ~270 ppb | ~336 ppb | +0.21 | Fertilizers, industrial processes |
Extreme Event Attribution Science
This rapidly evolving field employs high-resolution climate models and advanced statistical frameworks to quantify the influence of anthropogenic climate change on specific extreme weather events. The core methodolgy involves running thousands of simulations of a factual world with present-day greenhouse gas levels and a counterfactual world without human influence, allowing scientists to calculate probabilistic changes in event frequency and intensity.
Attribution studies have conclusively demonstrated that the likelihood and severity of heatwaves, such as the 2021 Pacific Northwest and 2022 European events, have increased by orders of magnitude due to climate change. Similarly, the thermodynamic influence of a warmer atmosphere, which holds approximately 7% more moisture per degree Celsius (Clausius-Clapeyron relation), has been shown to significantly intensify extreme precipitation events and associated flooding, as evidenced in analyses of hurricanes like Harvey and atmospheric rivers. For complex events like droughts or tornado outbreaks, where dynamic atmospheric circulation plays a larger role, attribution statements are more nuanced but increasingly robust, utilizing conditional probability and storyline approaches to isolate the thermodynamic contribution.
Earth's Energy Imbalance: The Fundamental Metric
The Earth's Energy Imbalance (EEI) is the most fundamental metric of climate change, representing the difference between incoming solar radiation and outgoing terrestrial radiation. A positive EEI, currently estimated at approximately +1.0 Watt per square meter globally, unequivocally indicates that the planet is accumulating heat, with the consequences manifesting as increased ocean heat content, melting ice, and rising atmospheric temperatures.
Precise measurement of EEI is extraordinarily challenging, requiring the closure of the global energy budget. Satellite-based radiometers, such as those in NASA's Clouds and the Earth's Radiant Energy System (CERES) program, measure top-of-atmosphere fluxes with high accuracy. These measurements must be reconciled with in-situ observations of ocean heat content change, which serves as the primary calorimeter for the climate system, accounting for over 90% of the excess energy. Discrepancies between the two methods drive improvements in instrument calibration and our understanding of Earth's energy flows.
The magnitude of the EEI is determined by changes in radiative forcing and the planet's climate sensitivity. While radiative forcing from greenhouse gases is relatively well-known, uncertainties in aerosol forcing and low-level cloud feedbacks represent the largest sources of error in EEI quantification. A sustained positive imbalance commits the planet to further warming even after atmospheric greenhouse gas concentrations stabilize, due to the slow response of the deep ocean. Monitoring trends in EEI is therefore critical for assessing the effectiveness of mitigation policies and for refining projections of future climate change, as it integrally links forcing, feedbacks, and system response in a single, overarching physical quantity.
Climate Modeling and Future Projections
General Circulation Models (GCMs) are the primary tools for projecting future climate, solving the fundamental equations of fluid dynamics and thermodynamics on a three-dimensional grid. These models, developed by institutions worldwide and coordinated under the Coupled Model Intercomparison Project (CMIP), integrate components for the atmosphere, ocean, land surface, and cryosphere.
Future projections are contingent upon Shared Socioeconomic Pathways (SSPs), which describe plausible narratives of future emissions, land use, and population growth. Each SSP is paired with a Representative Concentration Pathway (RCP) defining the resultant radiative forcing, creating scenarios ranging from stringent mitigation (SSP1-2.6) to unabated fossil fuel development (SSP5-8.5). Projected warming by 2100 spans from 1.4°C to 4.4°C, hinging critically on these societal choices.
Key uncertainties in projections stem from three primary sources: parameterization of sub-grid scale processes, such as cloud microphysics and convection; the global climate sensitivity to a doubling of CO₂; and the future evolution of natural and anthropogenic aerosols. Model intercomparison projects are essential for quantifying this uncertainty and improving physical realism.
- Structural Uncertainty: Differences in how models represent physical processes (e.g., cloud feedbacks) lead to a spread in climate sensitivity estimates, which remains a central research challenge.
- Scenario Uncertainty: Human decisions regarding energy systems, technology, and policy introduce the largest divergence in long-term temperature and sea-level projections.
- Internal Variability: Natural fluctuations in the climate system (e.g., Pacific Decadal Oscillation) can temporarily mask or amplify the long-term anthropogenic trend, especially at regional scales.
Advanced modeling frameworks now employ high-resolution dynamical downscaling using Regional Climate Models (RCMs) to provide actionable information at scales relevant for adaptation. Furthermore, data assimilation techniques, which merge model physics with observational data, are used to initialize decadal climate predictions, offering insights into near-term climate evolution. The latest model generations show improved simulation of historical mean climate and variability, yet persistent biases, such as in tropical precipitation patterns, drive ongoing model development. Ensemble modeling, which runs multiple simulations with slightly varied initial conditions or physics, provides a probabilistic framework for risk assessment, indicating not just a change in mean climate but a significant alteration in the frequency and intensity of extreme events across all plausible futures.