An Uneven Force
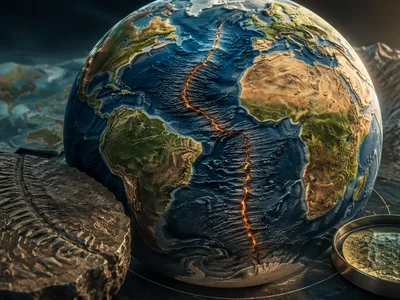
Gravity is not a constant, uniform force across our planet's surface. It varies subtly from place to place, creating an invisible topography of peaks and valleys.
This variation stems from the uneven distribution of mass within and on Earth. Mass anomalies, such as dense mountain ranges, tectonic plates, and deep-sea trenches, exert a slightly stronger gravitational pull. Conversely, regions with mass deficits, like ocean basins or deep groundwater aquifers, produce a measurably weaker pull. The planet's rotation and its oblate spheroid shape further complicate this gravitational field, making it a dynamic and complex signature of Earth's interior structure and surface features. Precise measurement of these minute differences, often expressed in units called galileos or milligals, forms the foundational data for modern gravimetry.
These gravitational undulations are far too slight for humans to perceive, but they are critical for understanding geophysical processes. Gravity maps effectively visualize this hidden landscape of force. They translate intricate satellite and ground-based measurements into a comprehensible picture, revealing secrets about crustal composition, mantle dynamics, and the continuous movement of Earth's water. The field dedicated to these measurements, known as gravimetry, has evolved from pendulum experiments to ultra-sensitive atomic instruments and sophisticated satellite duos, enabling a revolutionary view of our world.
How Are Gravity Maps Created?
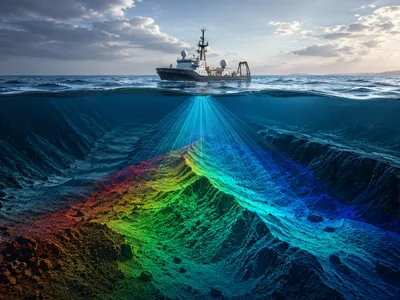
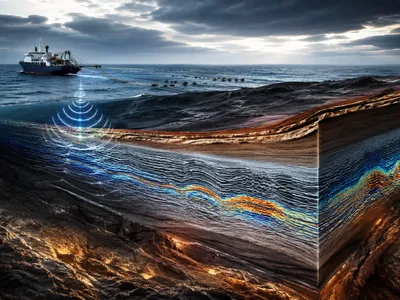
Constructing a global gravity map is a monumental task requiring space-age technology and complex physics. The most comprehensive data comes from dedicated satellite missions like ESA's GOCE and the NASA-German GRACE duo. GOCE employed a gradiometer to measure gravitational acceleration differences along three axes with unprecedented spatial resolution. Meanwhile, the GRACE satellites used a precise microwave ranging system to track the minute changes in distance between them as they flew in formation; when the lead satellite passed over a region of higher mass, it was pulled slightly ahead, and this inter-satellite ranging detected the resulting distance change. This method is exceptionally sensitive to temporal changes in gravity caused by moving water masses.
Terrestrial and airborne surveys complement satellite data, especially in regions requiring high-resolution detail. These surveys use absolute and relative gravimeters, which can measure the acceleration due to gravity at a specific point. All these raw measurements are then processed through advanced geophysical models that account for tides, atmospheric pressure, and polar motion. The final step involves sophisticated mathematical techniques, like spherical harmonic analysis, to synthesize billions of data points into a seamless, global model of Earth's geoid and gravity anomalies. This synthesis creates the detailed maps used by scientists today.
The Planet's Hidden Architecture
Regions with positive gravity anomalies indicate an excess of mass, often from dense rock formations or thick, ancient crust. These maps can trace the subsurface extent of mountain roots, known as orogenic belts, and identify dense oceanic slabs subducting into the mantle.
Conversely, negative anomalies highlight mass deficits, such as sedimentary basins filled with less dense material or regions where hotter, buoyant mantle material rises. This data is crucial for modeling lithospheric flexure, the bending of tectonic plates under loads like volcanoes or ice sheets, and for understanding the formation of continental cratons. By separating the gravitational signal of surface topography from deeper density contrasts, rresearchers construct detailed models of the Mohorovičić discontinuity, the boundary between the crust and mantle. These models provide essential constraints on the thermal and compositional state of the lithosphere.
The following table summarizes key geological features correlated with specific gravity signatures observed in maps.
| Geological Feature | Typical Gravity Anomaly | Implied Subsurface Condition |
|---|---|---|
| Ancient Continental Shield (Craton) | Positive to Neutral | Thick, cold, and dense lithospheric root |
| Active Oceanic Trench | Strong Negative | Low-density sediments and water-filled trench |
| Mid-Ocean Ridge | Negative | Hot, upwelling, low-density mantle material |
| Large Igneous Province | Variable (Often Positive) | Dense mafic intrusions or underplating |
Tracking Water in Motion
Satellite missions like GRACE and its successor GRACE-Follow On measure monthly changes in Earth's gravity field. Since changes in the solid earth occur over millennia, short-term signals are dominated by the redistribution of water mass. A gain in mass from heavy rainfall or snowpack increases the local gravitational pull, while drought or groundwater extraction creates a measurable decrease. This allows scientists to calculate changes in total water storage, integrating soil moisture, groundwater, surface water, and snow/ice.
The technique has revealed alarming trends in major aquifers globally, showing unsustainable depletion rates that are difficult to monitor with traditional well networks. It also tracks continental-scale drought patterns and the hydrological recovery from major flood events. Gravity maps thus provide a global scale for the water cycle. The specific applications of this data are critical for water security, as shown in the following list of monitored systems.
Gravimetric monitoring provides vital data for the following key components of the hydrosphere:
- Aquifer Depletion: Quantifying groundwater loss in regions like the North China Plain and California's Central Valley.
- Glacial Meltwater Contribution: Assessing runoff from melting ice sheets and mountain glaciers into oceans.
- Large Basin Hydrology: Tracking seasonal flood pulses and water storage in river basins such as the Amazon and Congo.
- Land Water Storage: Evaluating the impact of droughts and extreme precipitation events on continental-scale water reserves.
Beneath the Ice Sheets
By detecting minute changes in gravity over time, scientists can directly calculate the loss or gain of ice mass, separating the signal of recent snowfall from the melt of ancient ice. This method integrates the entire hydrological column, from surface meltwater to the discharge of icebergs, offering a comprehensive view that complements altimetry measurements. The data reveal not just long-term trends of significant mass loss but also shorter-term dynamic events, such as the rapid acceleration of glacier flow following ice shelf collapse. This precise accounting is critical for forecasting sea-level rise.
Beyond tracking ice melt, gravity maps also sense the Earth's slow viscous response to the disappearing weight of the ice, a process known as Glacial Isostatic Adjustment (GIA). As the massive ice sheets diminish, the underlying mantle rock begins to flow back upward. This rebound creates a subtle increase in gravitational pull that must be carefully modeled and separated from the signal of modern ice loss. Accurate GIA models are essential for interpreting the raw gravity data and for understanding the evolving shape and stress state of the crust in polar regions. The interplay between ice loss and bedrock rebound is a key factor in the stability of remaining ice shelves and grounding lines.
A Tool for Resource Exploration
Gravity surveys are a fundamental geophysical method in the search for subsurface resources, from minerals and hydrocarbons to groundwater.
The principle is straightforward: deposits with a density different from their surrounding host rock create a localized gravity anomaly. Dense mineralizations, such as metallic ores, produce a measurable positive anomaly, while lower-density resources like salt domes, certain coal seams, or porous aquifers generate a negative anomaly. Airborne gravimetry allows for the rapid, cost-effective screening of large, remote areas to iidentify promising targets for more detailed seismic or drilling campaigns. Modern high-resolution surveys can detect features as subtle as ancient river channels now filled with mineral-rich sediments or the edges of sedimentary basins.
In hydrocarbon exploration, gravity and magnetic data are used jointly in a regional context to map basement depth, delineate major sedimentary basins, and identify large-scale structural traps. The table below categorizes how different subsurface resources typically manifest in gravity data, guiding initial exploration decisions.
| Resource Type | Typical Density Contrast | Gravity Anomaly Signature | Exploration Context |
|---|---|---|---|
| Massive Sulfide Ore (e.g., Copper, Zinc) | High (+) vs. Host Rock | Local Positive Bouguer Anomaly | Base metal exploration in volcanic terrains |
| Salt Diaphragm | Low (-) vs. Sediments | Local Negative Anomaly | Hydrocarbon trap identification in basins |
| Iron Formation | Very High (++) | Strong, Elongated Positive Anomaly | Mapping extent of banded iron formations |
| Freshwater Aquifer | Low (-) vs. Bedrock | Subtle Regional Low | Delineating basin geometry for groundwater |
The interpretation of these anomalies requires sophisticated processing to separate the often-small target signal from regional geological trends and terrain effects. Advanced inversion modeling transforms the gravity map into a 3D density model, providing a crucial visual hypothesis of the subsurface.
Key natural resources where gravity mapping plays a definitive role in discovery and assessment include the following critical reserves.
- Base and Precious Metal Deposits: Mapping dense ore bodies associated with volcanic massive sulfides or mineralized skarns.
- Hydrocarbon Reservoirs: Identifying low-density salt structures that act as traps for oil and natural gas.
- Groundwater Resources: Defining the geometry and volume of major aquifer systems in sedimentary basins.
- Strategic Minerals: Locating high-density deposits of minerals like chromite, barite, or rare earth elements.
Future Signals in Gravity Data
Quantum gravimeters, which use the wave-like properties of ultra-cold atoms to measure acceleration, are transitioning from laboratory prototypes to field-deployable instruments. These devices offer stability and accuracy far exceeding classical spring-based or falling-corner-cube gravimeters. Concurrently, planned satellite missions aim for improved sensor technology and satellite constellations that could provide weekly or even daily global gravity snapshots.
This data deluge will be managed and interpreted through advanced machine learning algorithms and data assimilation techniques. Artificial intelligence can identify subtle, complex patterns in gravity anomalies that elude traditional analysis, potentially predicting volcanic unrest or refining groundwater models. Integrating high-resolution gravity data with other geodetic observations like InSAR (Interferometric Synthetic Aperture Radar) and GNSS will create unified, multi-parameter models of Earth system processes. The scientific frontier is expanding toward monitoring smaller-scale cryospheric changes, quantifying the global carbon cycle via forest biomass, and even probing deeper mantle dynamics with unprecedented clarity. The evolution from static maps to a real-time, diagnostic gravitational pulse of the planet is the defining trajectory for this field, transforming our capacity to observe and understand Earth's most intricate systems.